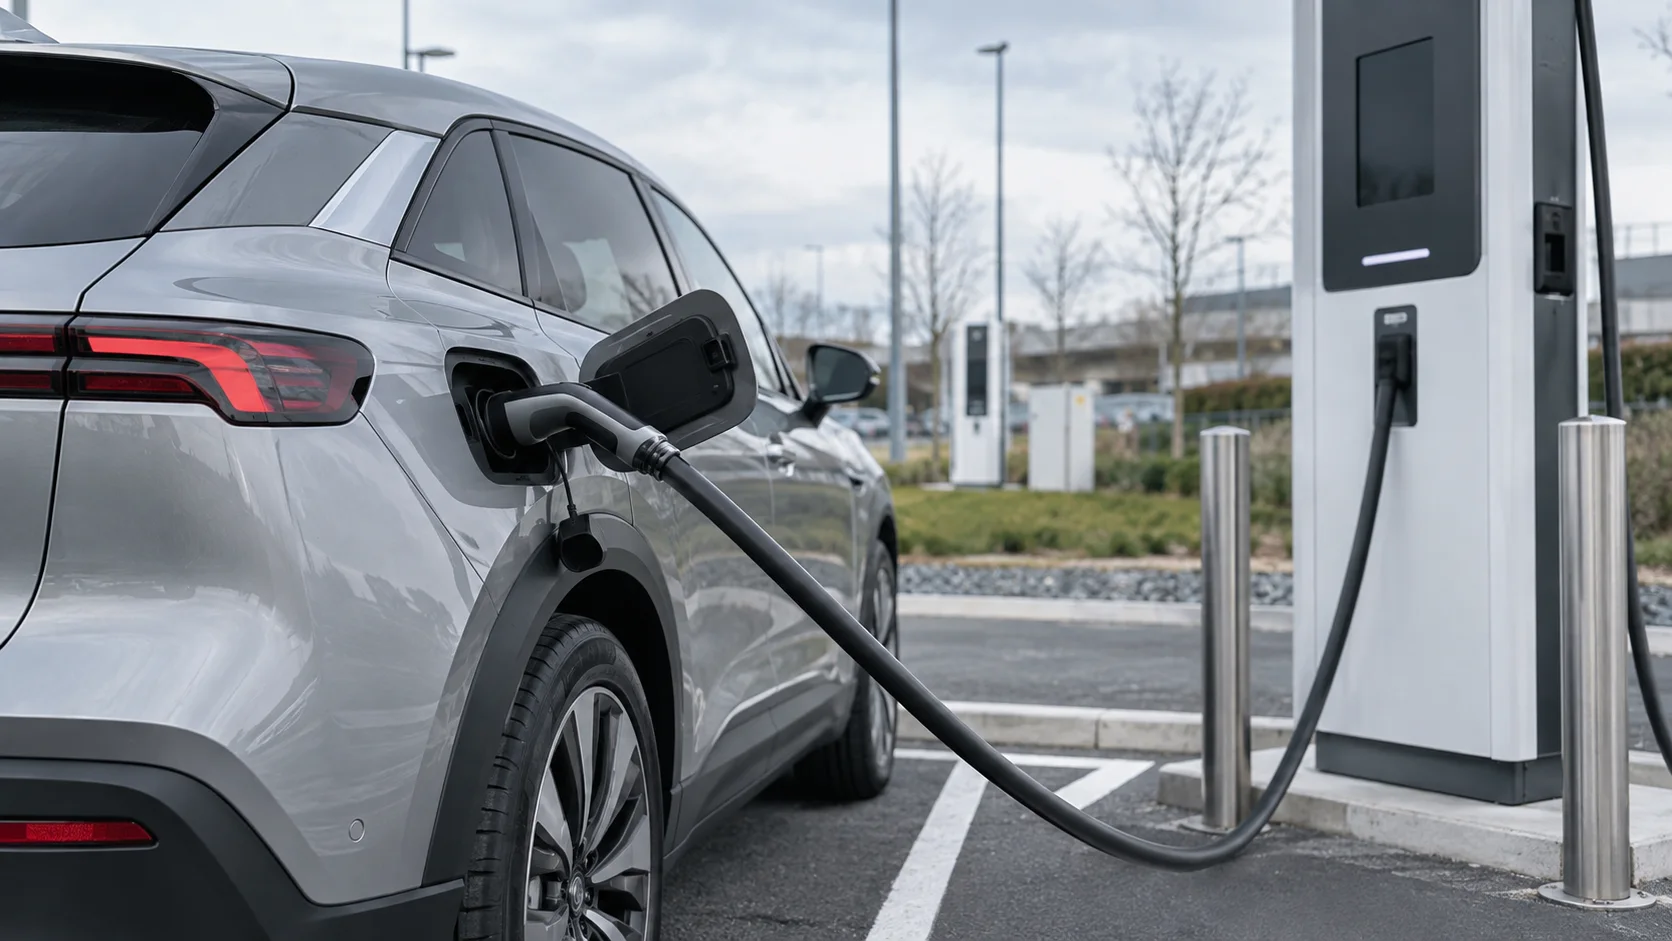
An EV fast-charging curve illustrates the power an electric vehicle can accept from a DC fast charger, plotted against the battery's state of charge (SoC). Understanding this curve helps drivers predict charging durations and optimise stops on longer journeys.
Why charging power changes with state of charge
The rate at which an EV battery can accept electrical power is not constant; it typically peaks at lower SoCs and then gradually decreases as the battery approaches full. This behaviour is primarily due to electrochemical and thermal limitations within the battery pack. At low SoCs, there are more available sites for lithium ions to intercalate into the anode material, allowing for higher current flow without excessive stress. As the SoC increases, these sites become scarcer, and forcing more ions into the remaining sites requires higher voltages, which can lead to increased internal resistance and heat generation.
Battery management systems (BMS) actively monitor cell voltage, current, and temperature to protect the battery from damage. To prevent lithium plating, excessive heat, and accelerated degradation, the BMS reduces the charging power as the SoC rises. This power reduction is a critical protective measure, ensuring the battery's longevity and safety, as mandated by regulations such as UNECE Global Technical Regulation No. 22 on battery durability.
Interpreting a typical fast-charging curve
A fast-charging curve typically shows charging power in kilowatts (kW) on the vertical axis and battery SoC in percent (%) on the horizontal axis. A common curve profile starts with a rapid increase in power from 0% SoC, reaching a peak power level. This peak is often sustained for a period, typically between 10% and 50% SoC, before the power begins to taper. The tapering becomes more pronounced above 80% SoC, with power levels often dropping significantly.
For example, an EV might accept 150 kW at 20% SoC, maintain this until 50% SoC, then see a gradual reduction to 100 kW at 70% SoC, and a sharper drop to 50 kW at 80% SoC, further decreasing to minimal levels above 90% SoC. These values are illustrative; actual curves vary widely between vehicle models and battery chemistries. The maximum power stated by a manufacturer is often the peak power achievable, not a sustained average across the entire charging cycle.
Impact on journey planning
For drivers undertaking cross-border European journeys, understanding the charging curve is crucial for efficient travel. The most time-efficient strategy often involves charging only to the point where the power curve begins its significant decline, typically between 70% and 80% SoC, and then driving to the next charging stop. Continuing to charge beyond this point, especially above 80% SoC, yields diminishing returns in terms of energy added per unit of time.
For instance, adding 100 km of range by charging from 20% to 50% SoC might take significantly less time than adding the same 100 km by charging from 80% to 95% SoC, even if the total energy added is identical. On a hypothetical journey from Munich to Milan, a driver might plan shorter, more frequent stops, charging from 10% to 70% SoC at high-power stations, rather than fewer, longer stops aiming for 100% SoC. This approach minimises overall travel time by leveraging the battery's optimal charging window.
Factors influencing the charging curve in practice
While manufacturer-published curves represent ideal conditions, several real-world factors can alter charging performance. Ambient temperature is a significant variable; very cold or very hot conditions can reduce the battery's ability to accept high power. In cold weather, the BMS may limit charging power to prevent damage to the cold battery cells. Conversely, in very hot weather, the BMS might reduce power to prevent overheating.
The pre-conditioning of the battery can mitigate some temperature effects. Some EVs can actively heat or cool their battery packs to an optimal temperature before or during charging, especially when navigating to a DC fast charger. The specific charger's maximum power output and the vehicle's maximum acceptance rate also play a role. A 50 kW charger cannot deliver 150 kW, even if the vehicle is capable of accepting it. Conversely, a vehicle with a peak acceptance of 100 kW will not benefit from a 350 kW charger beyond its 100 kW limit. The Alternative Fuels Infrastructure Regulation (AFIR) mandates minimum power outputs for public charging points, but actual delivered power can still vary.
Verifying vehicle charging capabilities
Drivers can verify their vehicle's specific charging capabilities through several official sources. The vehicle's owner's manual typically provides details on maximum DC charging power and recommended charging practices. Manufacturer websites and official technical specifications sheets also list these figures. These documents often include a graphical representation of the charging curve or provide key power thresholds at different SoC percentages.
For new vehicles, the EU WLTP type-approval procedure includes tests relevant to energy consumption and range, which indirectly relate to battery performance. While WLTP does not directly publish charging curves, the underlying battery specifications are part of the vehicle's type-approval documentation. The EU Batteries Regulation further specifies requirements for battery performance and durability information, which manufacturers must make available. When selecting a vehicle, prospective buyers should consult these official sources to understand the realistic fast-charging performance rather than relying solely on peak power claims.