Romania recorded the European Union’s highest share of trips made by land in 2025, according to Eurostat figures released on 19 November 2026. The 94% result is striking, but it is also easy to misread. It does not mean that cars accounted for 94% of Romanian mobility, nor that 94% of people drive every day. The measure covers trips with at least one overnight stay, and “land” combines cars, trains, buses and coaches.
Cars were the main transport mode for about 71.3% of the qualifying trips made by Romanian residents. Buses and coaches represented approximately 13.6%, while rail accounted for roughly 8.9%. Together, these categories produce the 94% land share. Most of the remainder was air travel, with water transport making up only a very small part.
Romania ahead of Slovenia, Bulgaria and Czechia
EU residents made 1.2 billion trips in 2025. Across the Union, 81.4% were land-based, 17.2% used air transport and 1.4% used waterways. Cars were the main mode for 63.3% of all trips, railways for 13.3%, and buses or coaches for 3.8%.
Romania’s 94% land share was followed by Slovenia at 90.4%, Bulgaria at 89% and Czechia at 88.9%. This comparison describes the transport mix of residents in each country. It is not a ranking of traffic volume, infrastructure quality or the absolute number of journeys. A smaller country can have a higher share without generating more trips than a larger one.
The Eurostat dataset indicates around 21.6 million qualifying trips by Romanian residents. Approximately 20.3 million had a land mode as the main transport, including about 15.4 million primarily made by car. These are survey-based statistical estimates, and totals derived from displayed figures can differ slightly because of rounding.
What Eurostat counts — and what it excludes
The definition matters. Eurostat covers personal and professional or business trips by residents aged 15 or over only when they involve at least one overnight stay. Commuting, school runs, shopping, day visits and most everyday urban movement are therefore outside this measure.
The statistic counts trips rather than unique people. One traveller may be counted several times after taking several trips during the year. It says neither how many Romanian households own a car nor how frequently a person uses one during an ordinary week.
There is another important methodological detail. When a traveller uses several modes, Eurostat assigns the trip to the mode that covers the longest distance to the main destination. A traveller who drives to an airport and then takes a much longer flight is recorded under air. Someone who drives most of a route and uses a ferry for a shorter section may still be recorded under car.
Trip share is not distance share
The percentages are calculated from the number of trips, regardless of their length. A 150-kilometre weekend drive and a 2,000-kilometre flight each count as one trip. The dataset therefore cannot be used on its own to estimate kilometres travelled, fuel consumption or emissions.
This distinction also separates the tourism indicator from passenger-kilometre modal split statistics. Passenger-kilometres answer how much distance people covered with each mode. Eurostat’s tourism table asks which mode was the principal one for each trip involving an overnight stay. Both measures are valid, but they describe different behaviour and should not be substituted for one another.
Romania’s 71.3% car share is above the EU average of 63.3%. Yet the most pronounced difference concerns buses and coaches: their 13.6% Romanian share is more than three times the 3.8% EU average. Rail shows the opposite pattern, at about 8.9% for Romanian residents compared with 13.3% across the Union. Romania’s land record is therefore not simply a car record.
What the figures say about Romanian travel choices
The figures confirm that roads are central to overnight travel by Romanian residents. Cars provide door-to-door access to rural, mountain and coastal destinations, while buses and coaches play a notably larger role than they do across the EU as a whole. The dataset, however, does not establish why travellers make these choices. It does not separately measure ticket prices, rail frequency, road conditions, income or personal preference.
It would be tempting to treat the 94% share as a verdict on Romania’s infrastructure, but that interpretation goes beyond the evidence. Destination patterns, geography, distances, international connections and the availability of flights can all influence the mix. Establishing the weight of each factor requires additional data and a separate analysis.
For drivers, the practical conclusion is narrower but meaningful: among trips that include at least one night away, the car remains Romanian residents’ leading transport mode. For policymakers and operators, the numbers also show the scale of collective road transport and the gap between Romania’s rail share and the EU average.
A genuine record with a precise scope
Romania really does rank first, but for a tightly defined indicator: the share of overnight trips for which a land mode covered the longest distance to the main destination. It is not a league table of kilometres driven, daily congestion, car ownership or dependence on cars.
The accurate reading keeps two figures separate. Land transport represented 94% of qualifying trips by Romanian residents; cars accounted for about 71.3% of all trips. Buses, coaches and trains supplied most of the rest of the land share. That distinction does not diminish the importance of the automobile. It makes the result understandable, useful and comparable.
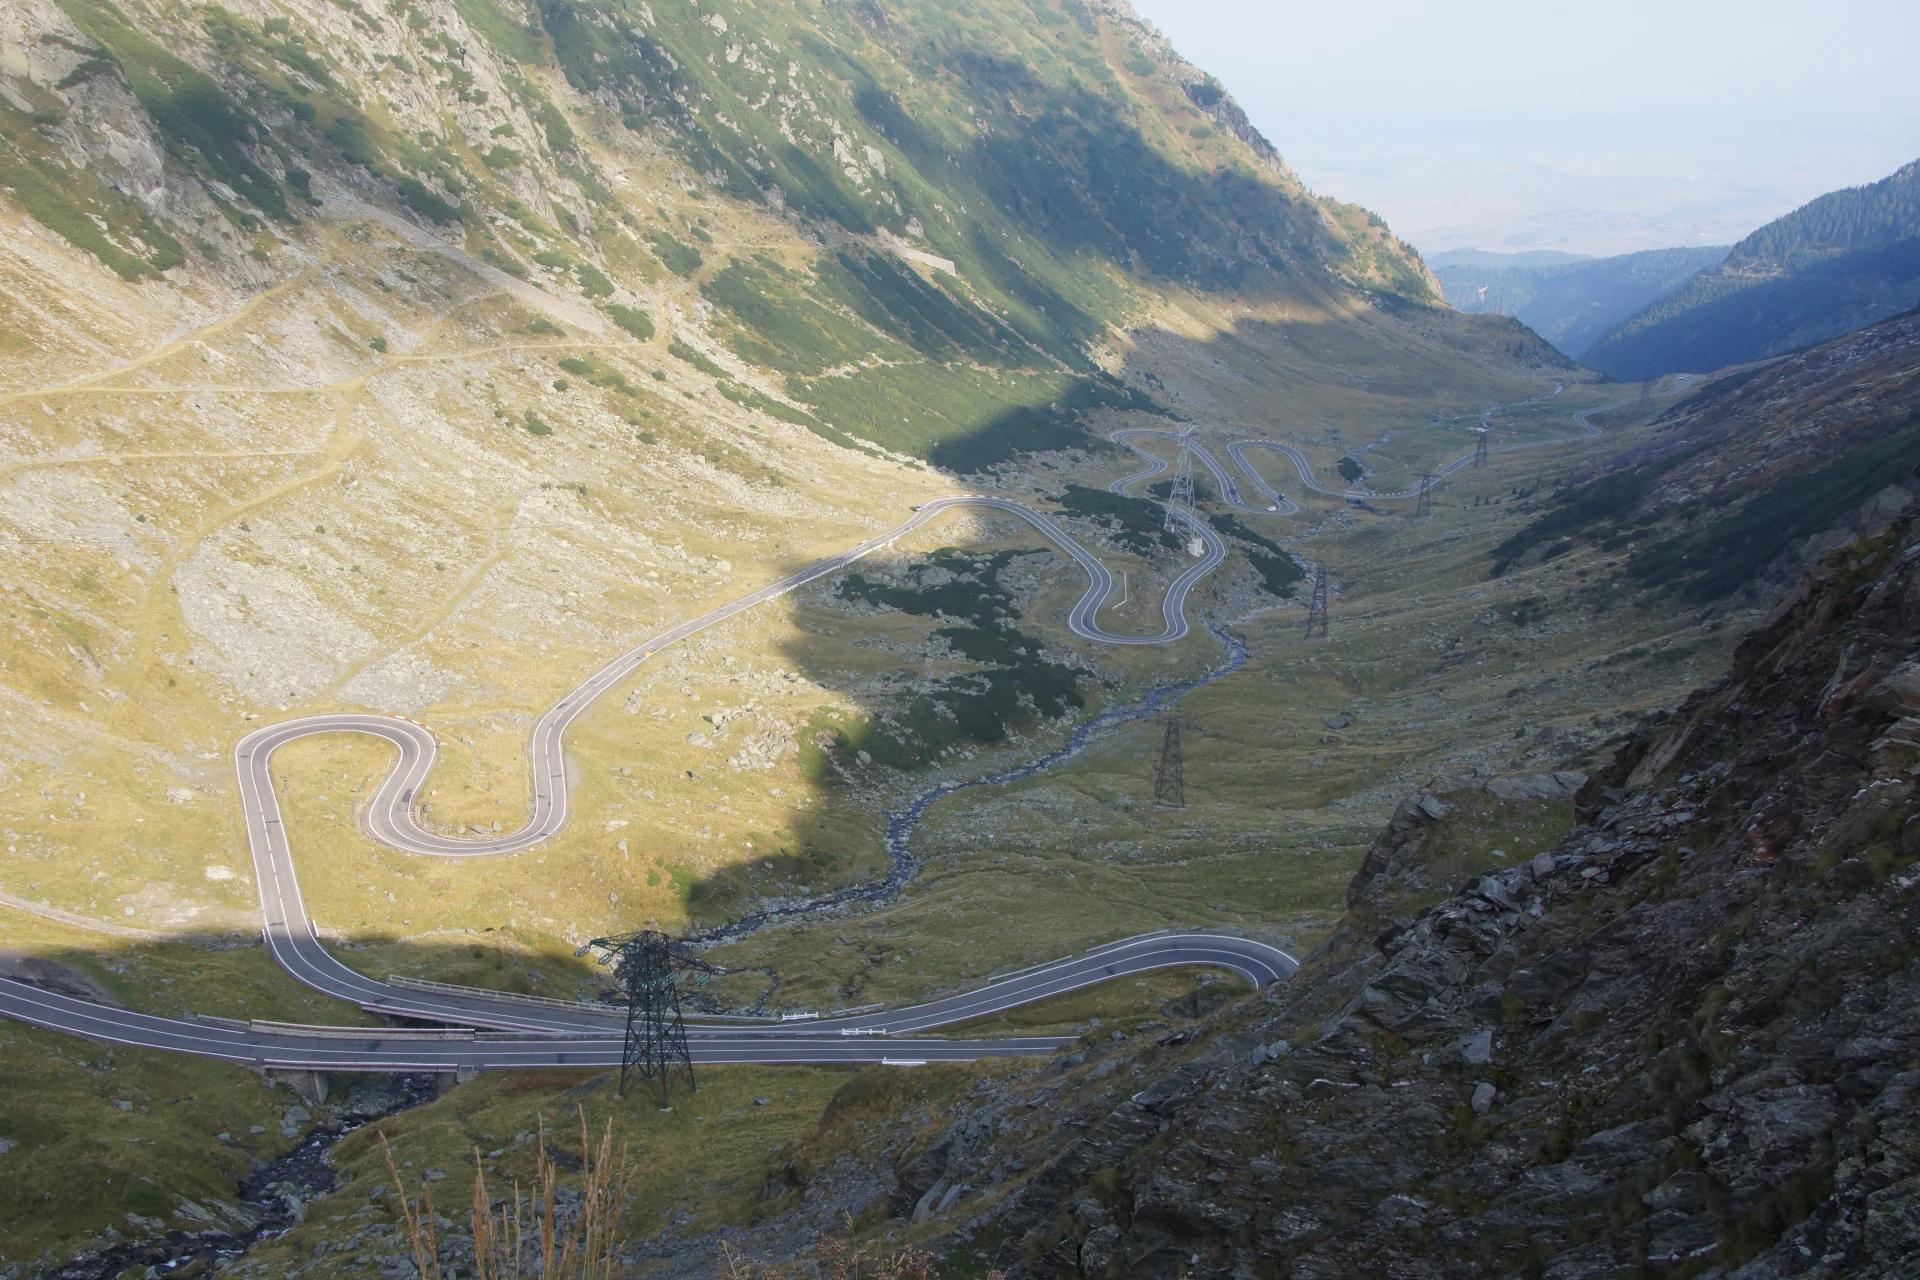
Photo: “Road in Romania” by rob Stoeltje, licensed under CC BY 2.0, via Wikimedia Commons. Resized and converted to WebP.