
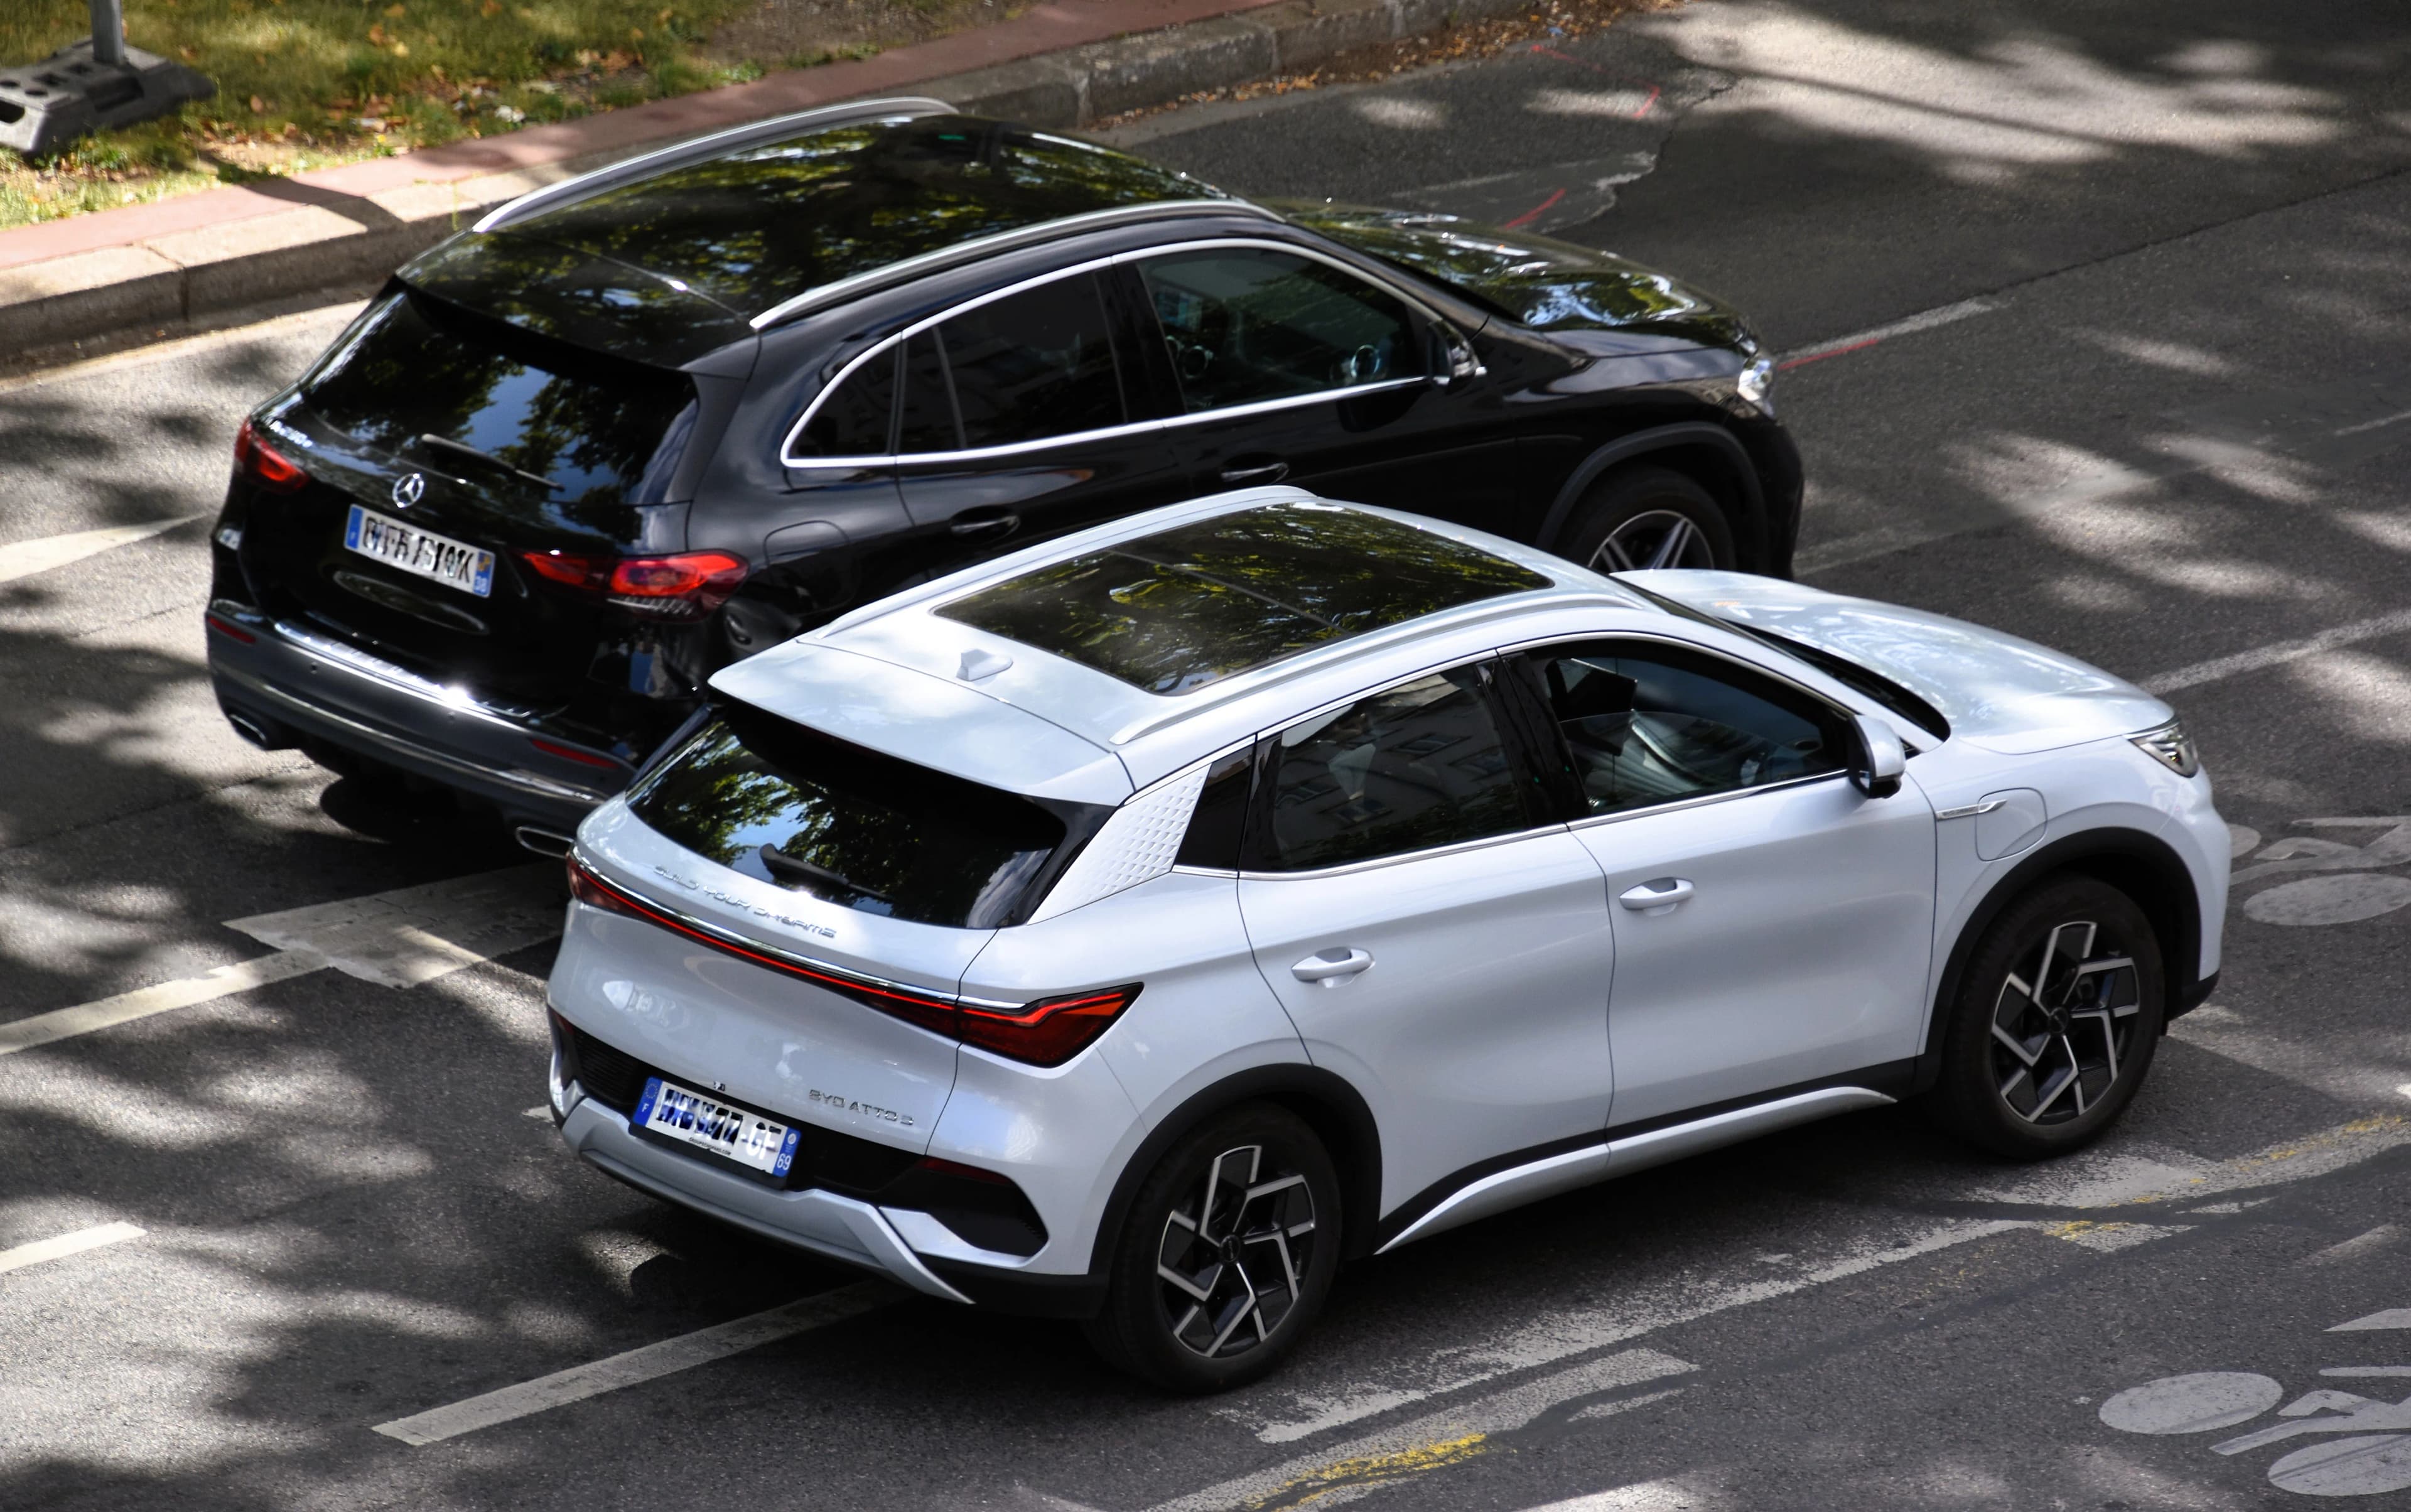
Chinese carmakers are narrowing the gap with established European manufacturers at a time when Europe’s market is growing but its industrial base is under pressure. A first-half 2026 review from the Center of Automotive Management (CAM) found that several Chinese groups reached operating margins close to, or above, the average of the 25 manufacturers in its comparison. At the same time, Chinese passenger-car exports rose sharply while domestic retail sales fell.
Europe is growing while China slows
CAM estimates that the three main automotive markets moved in opposite directions between January and June 2026. Europe, defined in the study as the EU, the United Kingdom and EFTA, grew by roughly 4.5% year on year. The United States declined by about 3%, while China fell by around 20%. Some June values were estimated from the previous months, so the figures should be read as a market comparison rather than as a registration table for every country.
The contraction in China helps explain why local manufacturers are looking abroad for volume. CAM reports that Chinese retail passenger-car sales fell 20.4% in the first half, to 8.8 million vehicles, while passenger-car exports rose 70.6%, to 4.28 million. Exporting does not guarantee profitability for every company, but it has become an important way to use production capacity and offset a difficult home market shaped by price competition.
ACEA’s full-year 2025 industry report shows how visible the change has become in Europe. EU-based manufacturers supplied 73% of the vehicles sold in the bloc, while cars made in China accounted for 7% of EU sales. The ACEA figure tracks the place of manufacture, not simply the nationality of a badge. A Chinese brand assembled in Europe and a European brand producing in China can therefore be treated differently in the statistics.
Chery and BYD are now profitable at scale
CAM compared revenue, EBIT, EBIT margin and operating result per delivered passenger car. Across all 25 manufacturers, the revenue-weighted EBIT margin fell to 3.5% from 4.4% in the comparable period. Combined EBIT declined 16.3%, while revenue fell only 1%. This is a difficult combination: manufacturers are maintaining substantial sales but are keeping less operating profit from each vehicle.
Chinese groups did not perform uniformly. Chery posted a 7.8% EBIT margin, the highest among the Chinese companies in the study and the second-highest overall. BYD recorded 4.3%, SAIC 3.4%, Great Wall Motor 3.2% and Geely Auto 2.7%. EV-focused Nio, XPeng and Li Auto remained loss-making at the operating level. The result is a useful correction to the idea that “Chinese automakers” form one financial block. Export-oriented groups and younger domestic EV specialists face different pressures.
CAM puts Chery’s first-half revenue at about €18 billion and EBIT at roughly €1.41 billion. BYD reached approximately €43.3 billion in revenue and about €1.85 billion in EBIT, with revenue close to Tesla’s level in the comparison. These numbers do not make the Chinese groups equal in scale to Volkswagen Group, Toyota or Stellantis. They do show that competitive pricing and overseas expansion are increasingly accompanied by operating discipline.
Exports are concentrated in a small group
From January to June 2026, Chery exported 931,557 passenger cars, representing 21.9% of the Chinese passenger-car exports tracked in the CPCA data used by CAM. BYD exported 769,330 vehicles, or 18.1%; Geely exported 472,456, or 11.1%; SAIC Passenger Vehicle exported 404,205, or 9.5%; and Great Wall Motor exported 256,000, or 6%. Together, the five groups represented about 66.6% of the exports in that dataset.
Chery’s international exposure is particularly high. Its exports represented 68.8% of 1,357,500 global deliveries in the first half, according to CAM. BYD’s export share rose to about 42.5%, compared with 20.7% in the first half of 2025. CAM notes that the Geely calculation covers the core Geely brand and excludes Volvo and Polestar, while the SAIC figure excludes SAIC-GM-Wuling. Those methodological boundaries matter when comparing groups.
Europe is one destination for this expansion, but it is not an easy market to enter. Brands need type approval, local distribution, service capacity, parts logistics and a credible warranty process. More imported cars do not automatically mean a durable brand position. Customer retention, fleet contracts, residual values and the cost of supporting vehicles after the sale will decide whether a strong launch becomes a sustainable business.
Batteries remain the industrial advantage
The International Energy Agency’s Global EV Outlook 2026 says China accounted for more than 80% of global battery-cell manufacturing capacity in 2025. Chinese producers supplied almost three quarters of batteries deployed in electric cars worldwide. In the European Union, LFP batteries represented more than 10% of EV battery demand in 2025, and almost all of those batteries were imported from China either as cells and packs or embedded in LFP-equipped cars.
The IEA estimates that battery production costs in Europe and the United States can be up to 50% higher than in China before public support is counted. The difference reflects manufacturing efficiency, automation, material costs, component supply and factory yields. A new battery plant must eventually exceed 90% production yield and reduce the proportion of cells that cannot be sold. That process takes time and money.
Cost leadership is not the same as universal product leadership. Safety, software, chassis calibration, after-sales support and depreciation must be judged separately. Euro NCAP named the Zeekr X the safest pure-electric car and the best small SUV it tested in 2024. The organisation also highlighted the Maxus eTERRON 9’s strong performance. European models still occupied several top positions, including the Mercedes-Benz E-Class, Volkswagen Passat and Škoda Superb. The evidence points to a smaller gap in safety performance, not to a blanket victory for either side.
Tariffs cannot replace industrial efficiency
The European Commission imposed countervailing duties on certain battery-electric vehicles made in China after an anti-subsidy investigation. Its automotive action plan says the measure will be monitored and that anti-circumvention investigations remain possible. The same document discusses rules of origin, foreign investment, batteries and components.
Trade measures can change the price of an imported car or encourage local assembly. They cannot, by themselves, create a battery supply chain, faster software development or a better-utilised factory. The IEA’s analysis describes China’s advantage as a result of scale and integration across several stages, from battery materials to vehicle production. European manufacturers can narrow the difference with simpler product ranges, common platforms, stronger supplier partnerships and lower fixed costs, but those changes will not appear immediately.
For European buyers, including customers in Romania, the competitive shift may bring more electric and hybrid choices. It also raises practical questions: who repairs the car, how quickly parts arrive, how the battery is covered after the warranty and what the vehicle will be worth later. The CAM, ACEA and IEA data describe a measurable industrial shift. They do not prove that European manufacturers have already lost the market. The next phase will be decided by total ownership cost, launch speed and the ability to earn a sustainable margin in Europe.
Sources
- Center of Automotive Management – AutomotivePERFORMANCE Report 2026
- Center of Automotive Management – first-half 2026 sales trends
- ACEA – full-year 2025 industry report
- IEA – Global EV Outlook 2026, batteries
- Euro NCAP – Best in Class cars tested in 2024
- European Commission – automotive action plan
- Wikimedia Commons – BYD Atto 3 photograph, CC0
_(54734025568).jpg)