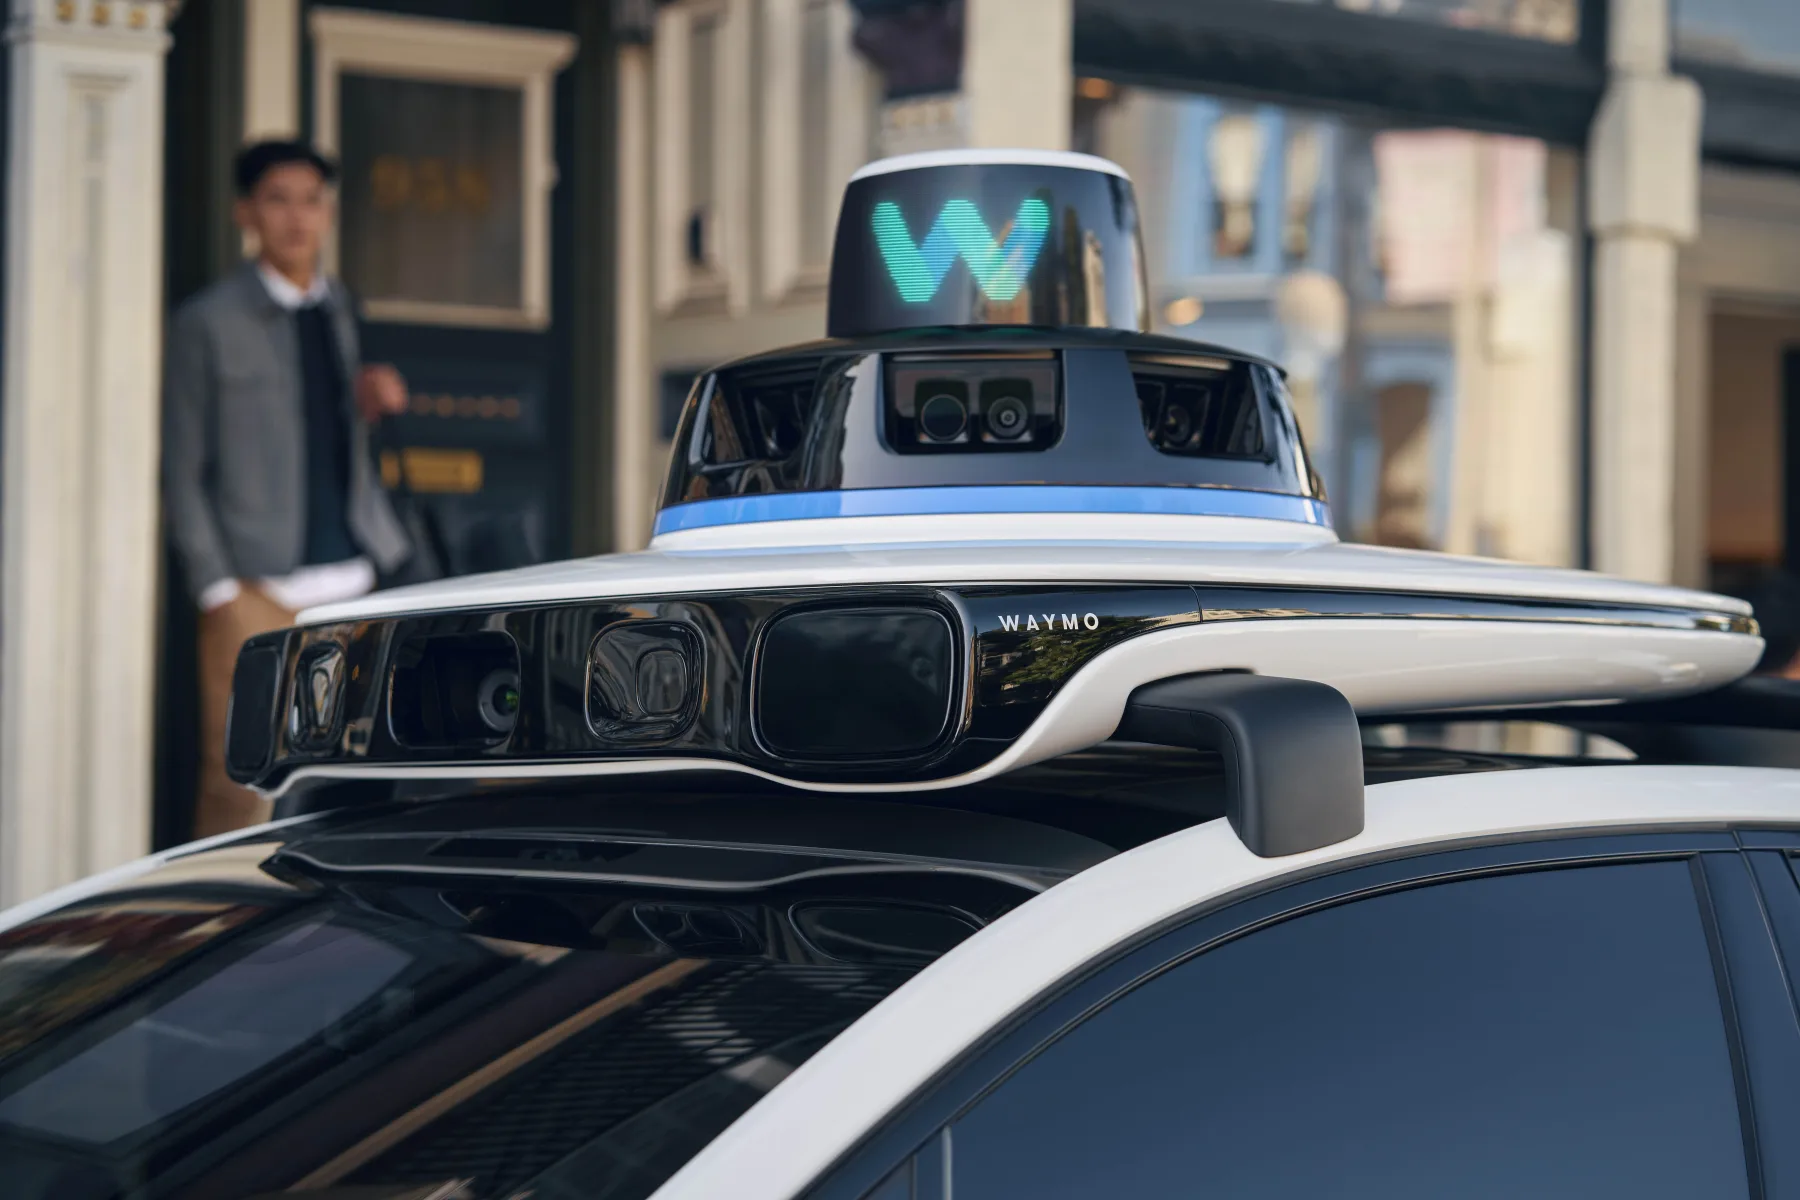
The fifth-generation Waymo Driver on an electric Jaguar I-PACE. Source: Waymo media resources
Waymo reports 82% fewer injury crashes across 271M miles
Waymo says its fully autonomous fleet was involved in 82% fewer injury-causing crashes than human drivers would have been over the same distance and in the same operating areas. The September 2026 update covers 271.3 million rider-only miles, or about 436.6 million km, accumulated through the end of June.
That headline requires a precise reading. The 82% is a difference in crash rates against a modelled human benchmark, not the share of journeys completed safely. Waymo includes relevant collisions regardless of fault and adjusts the comparison geographically. It does not claim that every type of autonomous car is 82% safer on every road.
What the updated dashboard measures
The mileage comes from five US metropolitan areas. Phoenix accounts for 92.121 million rider-only miles, the San Francisco Bay Area for 82.421 million, Los Angeles for 67.098 million, Austin for 21.064 million and the Atlanta area for 8.624 million. “Rider-only” means the automated system operated without a human driver in the vehicle.
Waymo calculates that the matched human benchmark would have produced 841 additional injury-causing crashes over that exposure. Its public statement equates that estimate with at least 841 people avoiding injury, using a conservative assumption of one injured person per crash. The underlying measured unit remains crashes, so the people figure is an estimate rather than a roster of individually identified cases.
For the most severe outcome, Waymo reports 95% fewer crashes involving a serious injury or worse, representing 55 fewer incidents than the human benchmark. Its dashboard lists an overall rate of 0.01 such incidents per million miles for the autonomous fleet and 0.21 for the benchmark. Crashes with an airbag deployment in any involved vehicle were 82% lower, a modelled difference of 358 events.
The vulnerable-road-user results
The comparison also separates crashes in which pedestrians, cyclists and motorcyclists were injured. Waymo reports reductions of 93% for pedestrians, 86% for cyclists and 82% for motorcyclists. In estimated counts, those gaps equal 86, 56 and 36 fewer crashes respectively.
These categories sit inside the overall injury-crash total; they are not an additional set to add on top of 841. They also describe Waymo’s current operational design domains: mapped areas, a centrally managed fleet and the conditions in which its Level 4 system is authorised to operate.
The distinction matters outside the US. A Level 4 robotaxi that can complete its task without a human supervisor inside a defined domain is fundamentally different from a Level 2 assistance package sold in a private car. Adaptive cruise control and lane centring still leave the driver responsible, even when a product name suggests a high degree of automation.
Independent research points in the same direction
An Insurance Institute for Highway Safety study published in July 2026 offers a useful independent check. IIHS researchers analysed federally mandated automated-driving crash reports, state police crash databases and mileage information. Their sample covered about 50 million driverless Waymo miles in Phoenix, San Francisco, Los Angeles and Austin, compared with roughly 222 billion human-driven miles in the same places and years.
After aligning the reporting thresholds, the researchers found that Waymo’s rate of involvement in crashes a reasonable person would report to police was 68% lower than the human rate. The rate for injury crashes was 81% lower. Those figures are close in direction to Waymo’s 82% claim, but they are not the same metric, sample or period and should not be presented as a direct replication.
Results also varied by city. Police-reportable crash involvement was 76% lower in Phoenix, 35% lower in San Francisco and 71% lower in Los Angeles. Austin showed a 4% higher rate, but the local driverless sample was small. An aggregate result therefore cannot describe every deployment equally well.
Why ordinary crash counts are misleading
Automated-vehicle operators and private drivers face different reporting practices. Companies submit detailed reports under the US National Highway Traffic Safety Administration’s Standing General Order, including incidents that might never reach a police database if two people were driving. IIHS notes that around half of all human-driver crashes and one-third of injury crashes go unreported.
To make the groups more comparable, the researchers removed duplicates, off-road events, cases in which automation was not engaged and reports that did not describe an actual crash. They then assessed whether the remaining events were severe enough to be reported by a typical driver. Only 22% of 736 public-road incidents with automation engaged were judged police-reportable or possibly police-reportable.
This work also exposes a regulatory gap. IIHS says the federal reporting system was designed primarily for defect investigations and recalls, not for continuous, like-for-like safety surveillance. Mileage is not consistently available for every operator, which is why the institute could calculate fleet crash rates only for Waymo.
What the numbers do and do not establish
The evidence now extends well beyond a short pilot, and both company data and an independent study find materially lower crash rates for the Waymo fleet. It is still bounded evidence. The vehicles operate in selected cities, severe crashes are rare, local road design changes the risk and the fleet has not accumulated exposure comparable with all US driving.
The next test is whether the advantage persists as Waymo adds cities, road types and weather conditions. City-level results, confidence intervals, raw incident records and consistent mileage reporting will matter more than a single national headline. For now, the defensible conclusion is narrower: within the places and periods studied, Waymo’s Level 4 fleet has recorded fewer injury and police-reportable crashes per mile than the matched human benchmarks.